In an attempt to describe the evolution of the dairy argentina in the last 50 years, we collected the data generated by the group CREATE Navarro founded in 1974 and disbanded in 2019, as if it were a mirror of the dairy premises. We cover data of dairy farms real in all this period complementing towards the end of the series, with data for some of the fields, former members, that continued to be produced but no longer participate in the group activity CREA y con ello completamos los datos de 2020 y armamos la proyección 2023p.
Tranqueras out the dairy argentina progresses slowly, but tranqueras inside there was a significant technical evolution, productive and economic. Below, we share some concepts concerning the evolution above and below the text you will find the graphics of each item analyzed:
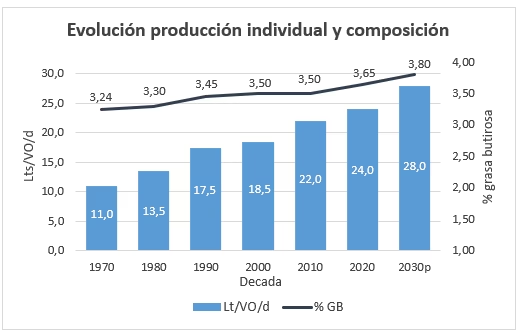
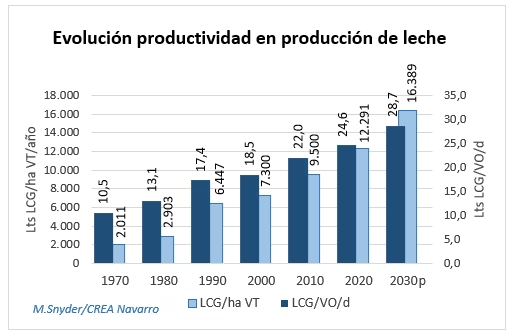
Production
The individual production grew by +2.3 per cent annually; the growth of components of the milk produced was +0.25% per annum and productivity (lt milk/ha) grew at a pace to +9.4% in one year. In all cases, we observed significant acceleration between 1970 and 1990 and then easing the crisis of 2001-2003 and onward. Remember, the decade of the 70s saw the mechanization widespread of milking and the use of artificial insemination.
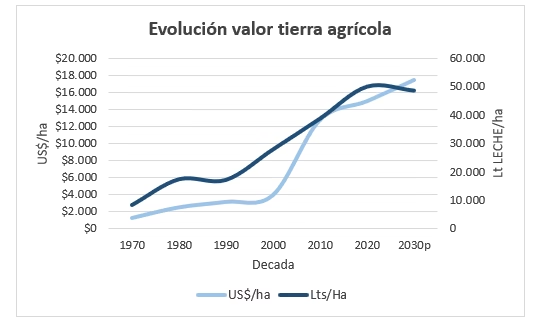
Land value
Interesting is to note the evolution of the value of the land (over 70% of the investment of the drums) by passing the agricultural quality of 1,245 US$/ha to 15,000 US$/ha in 50 years. This means higher rents (40% of the surface activity tambera is currently rented land). The cost of rent per cow grew by +5.7% in annual measured in litres of milk (from a 1.1 lt/VO/d to 4.4 lt/VO/d). The historical values of the earth were taken from the publication Margins Agricultural.
Power
The diets were changing, first with the highest amount of dry matter supplied by cow (+1.8% per annum), and then increasing the concentration with the addition of concentrated (+5% yoy). The food with the highest growth in supply per cow was the silage (mostly corn), which saw a growth of +35% per year. This is used very little in los70 and only in the 3 winter months (average year 0.4 kg MSO/VO/d), to cover 10 months of the year, with an annual average of 7 kg MSO/VO/d currently.
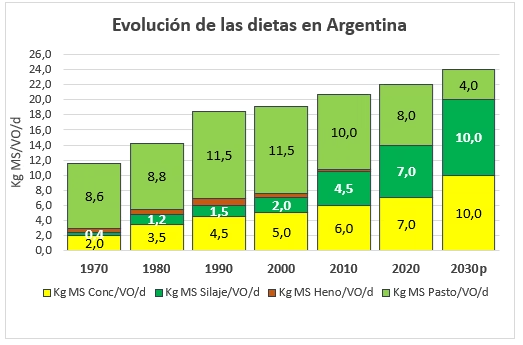
Charging animal
The evolution of the charging animal grew +1,6% per year based on increased productivity and quality of pastures (starting in the 70 festuca into meadows mixed and increasing significantly the level of fertilization), and the incorporation of crop summer for ensiling with which could have more cows in the winters when the grass was limiting.
Costs production
Making an estimate of the evolution of income and expenditure on food we put the numbers of the current market to the computations of the entire series. In the account of expenses in power consider the cost of ingredients, the cost of the distribution (from the year 2000 it became common to use the mixer in the fields) and we also consider a rental value of the land per cow/d to play the evolution of the price of the land. In the graphic with the evolution of the margin on food (ALL), we observed an increase of +1.7% in the LLA/VO/d and +2.8% in the LLA/HA/d.
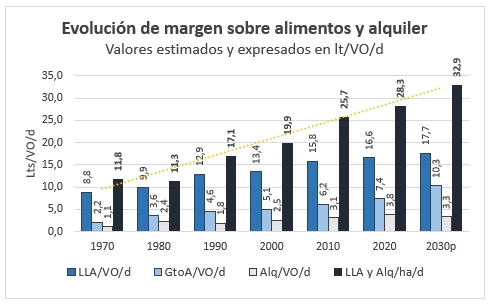
LLA= Litres free food; GtoA= Expenditure of food, expressed in litres/VO/d; Alq/VO/d= rental expressed in lt/VO/d; LLA and Alq/ha/d= Litres free food and rent/ha/d
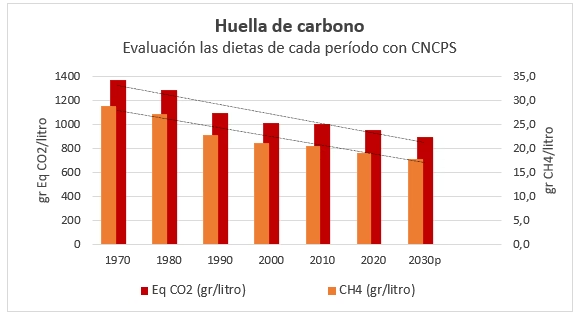
Climate change
In terms of environmental impact, something that began to measure recently, it was observed (using the nutrition program CNCPS Cornell) a decrease in the Carbon footprint the order of -32% basically thanks to the process of greater productive efficiency (the LGC/kg MSO passed from 0.92 to 1,12 lt/kg MSO marking a +22% increase in conversion efficiency in 50 years).