Monitoring of relative prices and production dairy south american
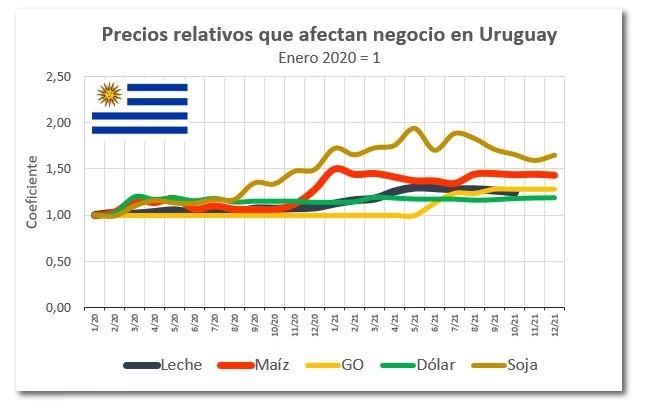
Here we present periodically the evolution of the price of milk to the producer, and the main inputs that affect the dairy industry in Argentina, Brazil, Chile and Uruguay. Also, in the end, the evolution of milk production regional. In this monitor regional follow the evolution of the relative prices of key inputs that affect the activity of dairy production in the region as it is the Corn (the thermometer features food that takes more than 50% of the direct costs), the Diesel (impacts minimally on a 15% on cost of production), the Us dollar (more than 70% of the inputs of the activity listed in dollars), the Soy (the value of which affects the protein source of the rodeo dairy and, in almost all cases, the payment of the rent of the land in production (for the chilean case we use Wheat in place of soy) and the price of milk.
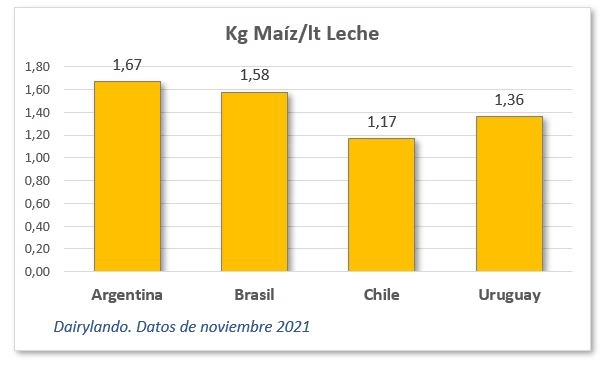
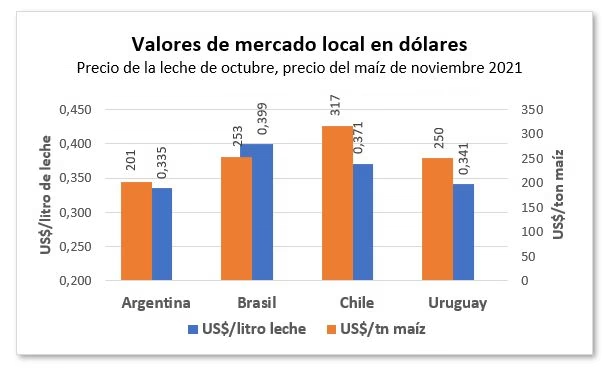
Then you will find a graphic with the Evolution of the Index of Costs compiled for ease of comparison, and also a comparison chart with the relative evolution of the producer prices by country. Finally a graph of input/output showing the pounds of corn that can be purchased with 1 lt of milk in each of the countries, as well as the current values of milk and corn to the producer.
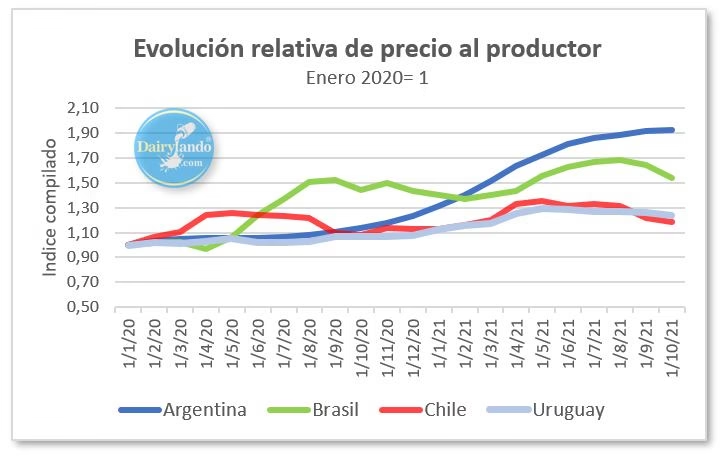
From the graphs it is noteworthy, the increase experienced by the costs of power that affects negatively in all cases, the activity, (except Uruguay, which presents an evolution bounded), while the price of milk to the producer experiences a decline or stagnation in the argentine case. There is also a trend in the recovery of the price of milk to the producer in 2021 for all cases. The economic stability of chile (variation dollar) generates curves with different trends to those observed in the rest of the countries.
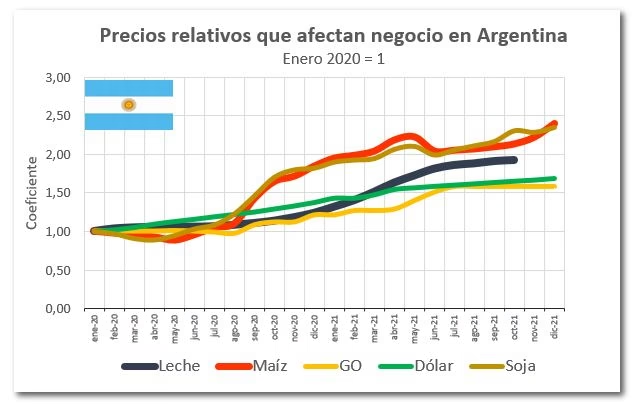
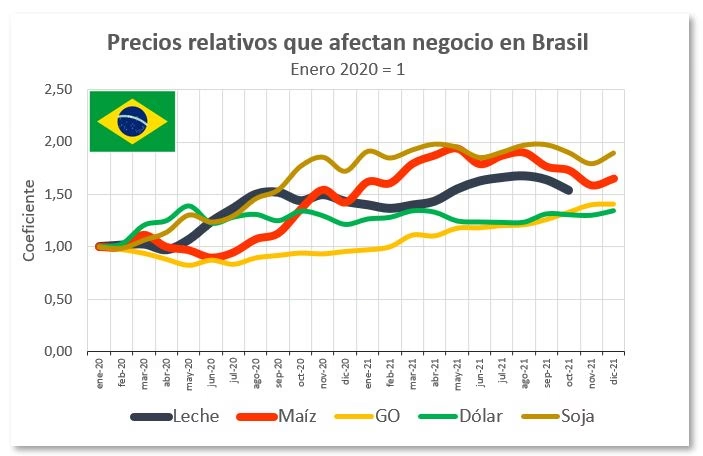
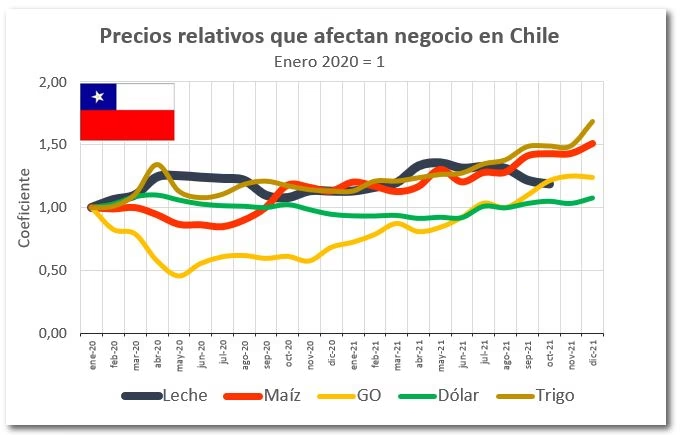
In the following charts, we see a compilation of the data generating the Index of costs and the price Index. In the first we can observe that the argentine producers are the ones who are suffering most of the increase in costs, followed by the brazilians, uruguayans, and finally, chilean citizens (the most stable economies). In the chilean case the production might suffer by the escalation of October and November.

In the costs of feeding the countries that presented the best value for purchase of corn per liter of milk (chart Kg Corn/lt Milk) are Argentina (1,67 kg), followed by Brazil (1,58 kg), then comes Uruguay (1.36 kg) and the most expensive of all is Chile with 1.17 kg of corn/lt of milk.
In regards to the evolution of the Index prices of milk to the producer, we see a better curve for the argentines, who maintains its growth, in a context of inflation, while the rest fell to their prices starting from September, very marked for the brazilian case.
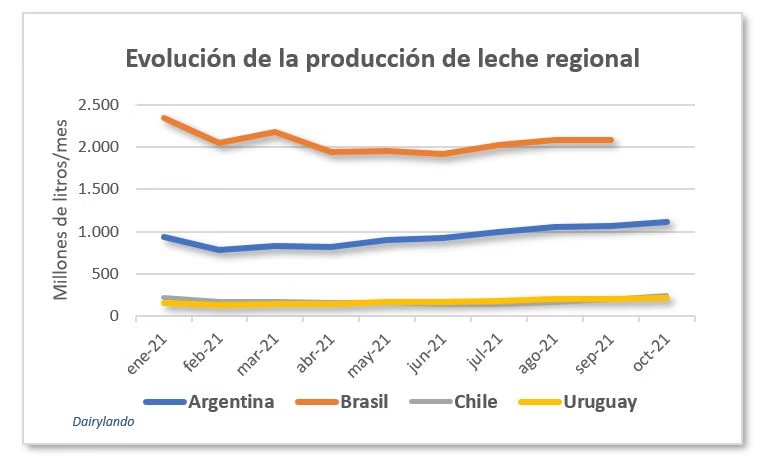
Evolution of the regional production: the group shows a similar trend for the last quarter
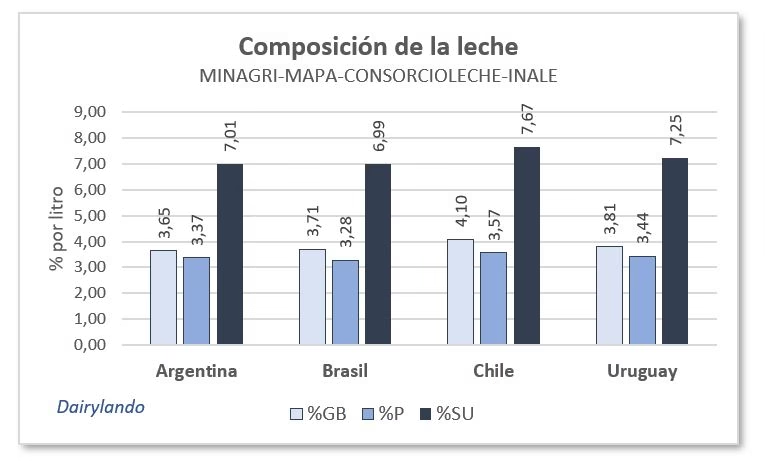
Quality milk year 2020